
M
Michael Robini
Guest
In this guest article, Michael Robini analyzes how many three letter .coms are used by end users.
What percentage of LLL.com domains are really used by end users?
1 – Answer
We chose to give an answer for each domains category (defined below in the article):
And we can merge these results, to have the figures in term of Chinese premium and Western premium domains:
And, finally, 43.2% of the whole LLL.com are developed and used by end users.
2 – Introduction
Before publishing the current article, I wrote two similar ones related to LLL.in domains. The first one presenting our statistical method can be read here, and the second one validating the method can be read here. Some domainers found that our analysis was relevant, and asked us to do the same for LLL.com, focusing on domains developed by end-users. And this requirement included an improvement: splitting the analysis between Chinese premium domains (i.e. domains without the letters a, e, i, o, u and v) and Western premium domains (i.e. domains without letters j, k, q, u, v, w, x, y and z). We accepted with pleasure since the result could be interesting for the whole domaining community.
This study mixes experimental analysis, statistics and computer science, and can be applied to any domain category: LLLL.com, a bunch of keywords domains, NNNN.com… We will try to detail as much as possible how to obtain the percentage of developed websites. Please also note that we are not the first to do this kind of analysis for LLL.com, Nat Cohen extracted this type of figures a few years back.
3 – Domains categories
First of all, the set of LLL.com domains on which we are working contains: 26x26x26 = 17,576 domains. Considering the letters included or excluded in each domains categories, the Chinese premium represent 20x20x20 = 8,000 domains, and the Western premium represent 17x17x17 = 4,913 domains.
We would like to point out that an overlap exist between Chinese premium and Western premium domains: DRT.com belongs to both categories for instance. These domains will be named ‘both premium’ in the next parts of this article, and are built using the letters B, C, D, F, G, H, L, M, N, P, R, S, T. Consequently, they represent: 13x13x13 = 2,197 domains.
With the introduction of this ‘both premium’ category, we indirectly created 2 new categories that we will name ‘pure Chinese premium’ and ‘pure Western premium’. They are, respectively, the Chinese premium minus the both premium and the Western premium minus the both premium. They represent respectively: 8,000 – 2,197 = 5,803 domains and 4,913 – 2,197 = 2,716 domains.
We are left with a last category: the domains that belong to none of the 3 other categories, or, in other words, that are neither Chinese premium nor Western Premium. These domains mix the Chinese premium but non Western premium letters J, K, Q, W, X, Y, Z, with the Western premium but non Chinese premium letters A, E, I, O, but also any letters with one of the letters U, V, since U and V are neither Chinese premium nor Western premium letters. They represent respectively 3,108 (mix of J, K, Q, W, X, Y, Z and A, E, I, O) and 3,752 (domains including U or V), and will be called ‘anti premium’ in the rest of the article. We have thus a total of 3,108 + 3,752 = 6,860 anti premium domains.
To sum up, we created 4 domains categories (the total is naturally equal to 26x26x26 = 17,576):
Clearly, all these numbers are too big to be analysed by looking at each domain one by one. But some clever ideas to do the job will be proposed in the next parts.
4 – Identify domains owned by domainers
We can start by removing parked domains (and domains owned by domainers) from the initial bunch of 17,576, since this will reduce the quantity of domains to analyse. To do this, the first step is to retrieve the nameservers of each domain. Using the nameservers, we will be able to identify all parked domains. Indeed, the nameservers of these domains will contain the name of well known parking companies like in NS1.SEDOPARKING.COM, NS1.PARKINGCREW.NET or NS1.BODIS.COM for instance. In order to list the nameservers of each LLL.com domain, we can either perform a ‘whois’ command of each of the 17,576 domain (longer, more complex, but most precise way), or scan directly the ‘Start Of Authority’ (SOA) field of the zone file by asking to a domain name server (the fastest, simpler, but somewhat sketchy way). More info on the zone file and SOA field here: Zone file.
For LLL.com, we computed the nameservers data the 13th May 2016, using the ‘whois’ approach. We obtained the following results, aggregated for the top 20 most occurring nameservers:
Rank Number of LLL.com Nameserver value Parking company or domainer
1 1,104 DNS1.IIDNS.COM No
2 1,080 BUY.INTERNETTRAFFIC.COM Yes
3 1,071 NS1BQX.NAME.COM Yes (Well known investor)
4 429 NS1.SEDOPARKING.COM Yes
5 385 NS1.ABOVE.COM Yes
6 345 PDNS01.DOMAINCONTROL.COM No (GoDaddy)
7 312 NS41.ROOKDNS.COM Yes
8 308 F1G1NS1.DNSPOD.NET No (DNS Hosting Provider)
9 294 NS1.4.CN Yes
10 239 DNS1.NAME-SERVICES.COM No (Enom)
11 196 NS1.PARKINGCREW.NET Yes
12 159 NS1.DNSNAMESERVICE.COM Yes (Investor, Gotw.com DNS Hosting)
13 157 NS1.DATINGOPINIONS.COM No
14 155 NS3.DOTZUP.COM Yes
15 153 NS0.DNSMADEEASY.COM No (DNS Hosting Provider)
16 114 NS1.BODIS.COM Yes
17 109 NS1.SMARTNAME.COM Yes
18 106 NS1.DSREDIRECTION.COM Yes
19 102 NS1.DREAMHOST.COM No
20 99 NS1.DIGIMEDIA.COM Yes (Investor)
Using this table, we can sum the number of domains parked at the main parking companies, or that belong to domainers (lines with ‘Yes‘ in the last column of the table): 1,080 + 1,071 + 429 + 385 + 312 + 294 + 196 + 159 + 155 + 114 + 109 + 106 + 99 = 4,509. This means that at least 4,509 or 25.7% of LLL.com domains are parked or into the hands of domainers, the 13th May 2016.
Others domains can be parked at smaller or unknown companies, can be not resolving, can be redirecting or can be developed websites. This last category includes domains under construction, domains with a unique simple or void page or real end user developed domains. And this is this last sub-category that will be of interest for us in the next parts.
5 – Determine a representative sample
We are now left with 17,576 – 4,509 = 13,067 domains to analyse. Let’s now split these 13,067 domains into the 4 categories we introduced in part 3: pure Chinese premium, pure Western premium, both premium and anti premium. We obtain the following figures for each category:
Naturally, the total number of domains from this 4 groups is: 4,416 + 2,243 + 1,819 + 4,589 = 13,067, that is the number of domains non-parked or not into domainers’ hands, established in part 4.
Again, each of these sub-groups contains a number of domains too big to be analysed one by one: we can’t look at each domain to check if it is resolving, if it is parked, developed, etc… So, in this second step, we will use statistical samples to evaluate, with a given and known precision, the number of developed domains in each group. In other words, we will look manually at small groups of domains, and we will extrapolate the result to the whole groups. But the ‘small’ groups need to be ‘big enough’ to have relevant results. For more details, you can have a look at the following pages: Sample size determination and Sample size calculator.
Let’s say we want to evaluate the number of developed domains with an error margin of 3%, and with a confident factor of 95%. In this case, the size of the statistical samples must be, for each domain category:
Again, looking one by one at all the domains contained in these 4 samples is not an easy task, even if they are smaller. We have to open an url and wait for the page loading for each domains… Instead of this, we created a small tool that takes screenshots of websites from a list a domains (using the Selenium tool and the PhantomJS webdriver. More info here). Like this, our final job is only to review 4 bunches of pics, to determine which domains are really developed in each of the 4 samples.
But before that, let’s detail below what is (or is not) a domain owned and developed by an end user:
For the first group of 4,416 pure Chinese premium domains that are not parked, we chosen randomly (using the Unix ‘shuf’ command) a sample of 860 of them and took the associated screenshots. From the pics analysis, we identified 391 developed domains corresponding to 45.5% of developed websites. This means that 2,009 domains over the initial group of 4,416 non-paked domains are developed. Thus, we can extrapolate that 2,009 domains in the full group of 5,803 pure Chinese premium domains are developed websites. That corresponds to 34.6%.
We repeated this exercise for the 3 other groups (pure Western premium, both premium, and anti premium) and we obtained the following final results for the 4 groups:
The last step of our study is to combine the result obtained in part 6 in order to have figures for Chinese premium, Western premium and the whole LLL.com domains. Starting from:
And if we want to present these result in term of ‘Chinese premium’ and ‘Western premium’ domains, we need to merge the ‘both premium’ percentage with respectively ‘pure Chinese’ and ‘pure Western’ percentage:
And if we want to obtain the overall percentage of LLL.com domains developed by end users, we combine all the previous results: [(34.6% X 5,803) + (59.6% X 2,716) + (58.4% X 2,197) + (39.1% X 6,860)] / 17,576 = 43.2%
Finally, we can give a few more details to interpret this last figure. 43.2% of domains developed by end users, does not mean that 100 – 43.2 = 56.8% of LLL.com domains are into the hands of domainers. In fact, some parked LLL.com are already into the hands of end users, but they are just not using them. And around 15% of all LLL.com are not resolving: for these domains, for can’t know if they belong to end users or domainers. We can only conclude that domainers own less than 56.8% and probably less than 50%, if we assume that non resolving LLL.com belong for half of them to domainers, and half of them to end users.
Acknowledgements and appendix
We would like to say thank you to Nat Cohen for the exchange of ideas, for his advices and for re-reading the article. A big thanks to you Nat.
Thank you to Andrew too, that accepted to publish this article on Domain Name Wire.
And a few words for the end: we would like to add that we are not IT experts nor mathematicians. Feel free to report any error in the study. All pics, samples, and software parts are available on demand.

© DomainNameWire.com 2016. This is copyrighted content. Domain Name Wire full-text RSS feeds are made available for personal use only, and may not be published on any site without permission. If you see this message on a website, contact copyright (at) domainnamewire.com.
Latest domain news at DNW.com: Domain Name Wire.
The post Here’s how many three-letter .coms are used by end users appeared first on Domain Name Wire | Domain Name News & Views.
No related posts.
Continue reading...
What percentage of LLL.com domains are really used by end users?
1 – Answer
We chose to give an answer for each domains category (defined below in the article):
- Pure Chinese premium: 34.6%
- Pure Western premium: 59.6%
- Both premium: 58.4%
- Anti premium: 39.1%
And we can merge these results, to have the figures in term of Chinese premium and Western premium domains:
- Chinese premium: 41.1%
- Western premium: 59.1%
And, finally, 43.2% of the whole LLL.com are developed and used by end users.
2 – Introduction
Before publishing the current article, I wrote two similar ones related to LLL.in domains. The first one presenting our statistical method can be read here, and the second one validating the method can be read here. Some domainers found that our analysis was relevant, and asked us to do the same for LLL.com, focusing on domains developed by end-users. And this requirement included an improvement: splitting the analysis between Chinese premium domains (i.e. domains without the letters a, e, i, o, u and v) and Western premium domains (i.e. domains without letters j, k, q, u, v, w, x, y and z). We accepted with pleasure since the result could be interesting for the whole domaining community.
This study mixes experimental analysis, statistics and computer science, and can be applied to any domain category: LLLL.com, a bunch of keywords domains, NNNN.com… We will try to detail as much as possible how to obtain the percentage of developed websites. Please also note that we are not the first to do this kind of analysis for LLL.com, Nat Cohen extracted this type of figures a few years back.
3 – Domains categories
First of all, the set of LLL.com domains on which we are working contains: 26x26x26 = 17,576 domains. Considering the letters included or excluded in each domains categories, the Chinese premium represent 20x20x20 = 8,000 domains, and the Western premium represent 17x17x17 = 4,913 domains.
We would like to point out that an overlap exist between Chinese premium and Western premium domains: DRT.com belongs to both categories for instance. These domains will be named ‘both premium’ in the next parts of this article, and are built using the letters B, C, D, F, G, H, L, M, N, P, R, S, T. Consequently, they represent: 13x13x13 = 2,197 domains.
With the introduction of this ‘both premium’ category, we indirectly created 2 new categories that we will name ‘pure Chinese premium’ and ‘pure Western premium’. They are, respectively, the Chinese premium minus the both premium and the Western premium minus the both premium. They represent respectively: 8,000 – 2,197 = 5,803 domains and 4,913 – 2,197 = 2,716 domains.
We are left with a last category: the domains that belong to none of the 3 other categories, or, in other words, that are neither Chinese premium nor Western Premium. These domains mix the Chinese premium but non Western premium letters J, K, Q, W, X, Y, Z, with the Western premium but non Chinese premium letters A, E, I, O, but also any letters with one of the letters U, V, since U and V are neither Chinese premium nor Western premium letters. They represent respectively 3,108 (mix of J, K, Q, W, X, Y, Z and A, E, I, O) and 3,752 (domains including U or V), and will be called ‘anti premium’ in the rest of the article. We have thus a total of 3,108 + 3,752 = 6,860 anti premium domains.
To sum up, we created 4 domains categories (the total is naturally equal to 26x26x26 = 17,576):
- Pure Chinese premium representing a total of 5,803 domains
- Pure Western premium representing a total of 2,716 domains
- Both premium representing a total of 2,197 domains
- Anti premium representing a total of 6,860 domains
Clearly, all these numbers are too big to be analysed by looking at each domain one by one. But some clever ideas to do the job will be proposed in the next parts.
4 – Identify domains owned by domainers
We can start by removing parked domains (and domains owned by domainers) from the initial bunch of 17,576, since this will reduce the quantity of domains to analyse. To do this, the first step is to retrieve the nameservers of each domain. Using the nameservers, we will be able to identify all parked domains. Indeed, the nameservers of these domains will contain the name of well known parking companies like in NS1.SEDOPARKING.COM, NS1.PARKINGCREW.NET or NS1.BODIS.COM for instance. In order to list the nameservers of each LLL.com domain, we can either perform a ‘whois’ command of each of the 17,576 domain (longer, more complex, but most precise way), or scan directly the ‘Start Of Authority’ (SOA) field of the zone file by asking to a domain name server (the fastest, simpler, but somewhat sketchy way). More info on the zone file and SOA field here: Zone file.
For LLL.com, we computed the nameservers data the 13th May 2016, using the ‘whois’ approach. We obtained the following results, aggregated for the top 20 most occurring nameservers:
Rank Number of LLL.com Nameserver value Parking company or domainer
1 1,104 DNS1.IIDNS.COM No
2 1,080 BUY.INTERNETTRAFFIC.COM Yes
3 1,071 NS1BQX.NAME.COM Yes (Well known investor)
4 429 NS1.SEDOPARKING.COM Yes
5 385 NS1.ABOVE.COM Yes
6 345 PDNS01.DOMAINCONTROL.COM No (GoDaddy)
7 312 NS41.ROOKDNS.COM Yes
8 308 F1G1NS1.DNSPOD.NET No (DNS Hosting Provider)
9 294 NS1.4.CN Yes
10 239 DNS1.NAME-SERVICES.COM No (Enom)
11 196 NS1.PARKINGCREW.NET Yes
12 159 NS1.DNSNAMESERVICE.COM Yes (Investor, Gotw.com DNS Hosting)
13 157 NS1.DATINGOPINIONS.COM No
14 155 NS3.DOTZUP.COM Yes
15 153 NS0.DNSMADEEASY.COM No (DNS Hosting Provider)
16 114 NS1.BODIS.COM Yes
17 109 NS1.SMARTNAME.COM Yes
18 106 NS1.DSREDIRECTION.COM Yes
19 102 NS1.DREAMHOST.COM No
20 99 NS1.DIGIMEDIA.COM Yes (Investor)
Using this table, we can sum the number of domains parked at the main parking companies, or that belong to domainers (lines with ‘Yes‘ in the last column of the table): 1,080 + 1,071 + 429 + 385 + 312 + 294 + 196 + 159 + 155 + 114 + 109 + 106 + 99 = 4,509. This means that at least 4,509 or 25.7% of LLL.com domains are parked or into the hands of domainers, the 13th May 2016.
Others domains can be parked at smaller or unknown companies, can be not resolving, can be redirecting or can be developed websites. This last category includes domains under construction, domains with a unique simple or void page or real end user developed domains. And this is this last sub-category that will be of interest for us in the next parts.
5 – Determine a representative sample
We are now left with 17,576 – 4,509 = 13,067 domains to analyse. Let’s now split these 13,067 domains into the 4 categories we introduced in part 3: pure Chinese premium, pure Western premium, both premium and anti premium. We obtain the following figures for each category:
- Pure Chinese premium non-parked: 4,416
- Pure Western premium non-parked: 2,243
- Both premium non-parked: 1,819
- Anti premium non-parked: 4,589
Naturally, the total number of domains from this 4 groups is: 4,416 + 2,243 + 1,819 + 4,589 = 13,067, that is the number of domains non-parked or not into domainers’ hands, established in part 4.
Again, each of these sub-groups contains a number of domains too big to be analysed one by one: we can’t look at each domain to check if it is resolving, if it is parked, developed, etc… So, in this second step, we will use statistical samples to evaluate, with a given and known precision, the number of developed domains in each group. In other words, we will look manually at small groups of domains, and we will extrapolate the result to the whole groups. But the ‘small’ groups need to be ‘big enough’ to have relevant results. For more details, you can have a look at the following pages: Sample size determination and Sample size calculator.
Let’s say we want to evaluate the number of developed domains with an error margin of 3%, and with a confident factor of 95%. In this case, the size of the statistical samples must be, for each domain category:
- Pure Chinese premium: 860
- Pure Western premium: 724
- Both premium: 673
- Anti premium: 866
Again, looking one by one at all the domains contained in these 4 samples is not an easy task, even if they are smaller. We have to open an url and wait for the page loading for each domains… Instead of this, we created a small tool that takes screenshots of websites from a list a domains (using the Selenium tool and the PhantomJS webdriver. More info here). Like this, our final job is only to review 4 bunches of pics, to determine which domains are really developed in each of the 4 samples.
But before that, let’s detail below what is (or is not) a domain owned and developed by an end user:
- A standard developed website, even a one page personal domain, whatever the quality of the website, is considered owned and used by an end user.
- A domain redirecting to a domain from the above category is considered owned and used by end user as well.
- A domain displaying a template page that can be found on other domains, is not considered in use by an end user. It is considered owned by investor.
- A domain showing ‘For sale’, or with only a contact form, is not considered owned by end user.
- A domain not resolving is not considered owned by end user.
- A parked domain is not considered owned by end user.
For the first group of 4,416 pure Chinese premium domains that are not parked, we chosen randomly (using the Unix ‘shuf’ command) a sample of 860 of them and took the associated screenshots. From the pics analysis, we identified 391 developed domains corresponding to 45.5% of developed websites. This means that 2,009 domains over the initial group of 4,416 non-paked domains are developed. Thus, we can extrapolate that 2,009 domains in the full group of 5,803 pure Chinese premium domains are developed websites. That corresponds to 34.6%.
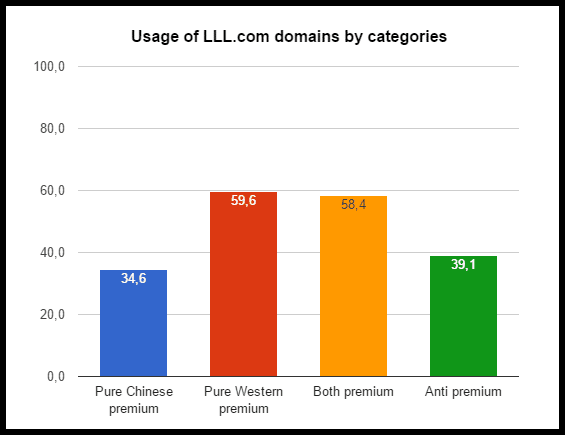
We repeated this exercise for the 3 other groups (pure Western premium, both premium, and anti premium) and we obtained the following final results for the 4 groups:
- Pure Chinese premium: 34.6% of developed websites
- Pure Western premium: 59.6% of developed websites
- Both premium: 58.4% of developed websites
- Anti premium: 39.1% of developed websites
The last step of our study is to combine the result obtained in part 6 in order to have figures for Chinese premium, Western premium and the whole LLL.com domains. Starting from:
- Pure Chinese premium represent a total of 5,803 domains from which 34.6% are used by end users
- Pure Western premium represent a total of 2,716 domains from which 59.6% are used by end users
- Both premium represent a total of 2,197 domains from which 58.4% are used by end users
- Anti premium represent a total of 6,860 domains from which 39.1% are used by end users
And if we want to present these result in term of ‘Chinese premium’ and ‘Western premium’ domains, we need to merge the ‘both premium’ percentage with respectively ‘pure Chinese’ and ‘pure Western’ percentage:
- Chinese premium: [(34.6% X 5,803) + (58.4% X 2,197)] / 8,000 = 41.1%
- Western premium: [(59.6% X 2,716) + (58.4% X 2,197)] / 4,913 = 59.1%
And if we want to obtain the overall percentage of LLL.com domains developed by end users, we combine all the previous results: [(34.6% X 5,803) + (59.6% X 2,716) + (58.4% X 2,197) + (39.1% X 6,860)] / 17,576 = 43.2%
Finally, we can give a few more details to interpret this last figure. 43.2% of domains developed by end users, does not mean that 100 – 43.2 = 56.8% of LLL.com domains are into the hands of domainers. In fact, some parked LLL.com are already into the hands of end users, but they are just not using them. And around 15% of all LLL.com are not resolving: for these domains, for can’t know if they belong to end users or domainers. We can only conclude that domainers own less than 56.8% and probably less than 50%, if we assume that non resolving LLL.com belong for half of them to domainers, and half of them to end users.
Acknowledgements and appendix
We would like to say thank you to Nat Cohen for the exchange of ideas, for his advices and for re-reading the article. A big thanks to you Nat.
Thank you to Andrew too, that accepted to publish this article on Domain Name Wire.
And a few words for the end: we would like to add that we are not IT experts nor mathematicians. Feel free to report any error in the study. All pics, samples, and software parts are available on demand.
© DomainNameWire.com 2016. This is copyrighted content. Domain Name Wire full-text RSS feeds are made available for personal use only, and may not be published on any site without permission. If you see this message on a website, contact copyright (at) domainnamewire.com.
Latest domain news at DNW.com: Domain Name Wire.
The post Here’s how many three-letter .coms are used by end users appeared first on Domain Name Wire | Domain Name News & Views.
No related posts.
Continue reading...